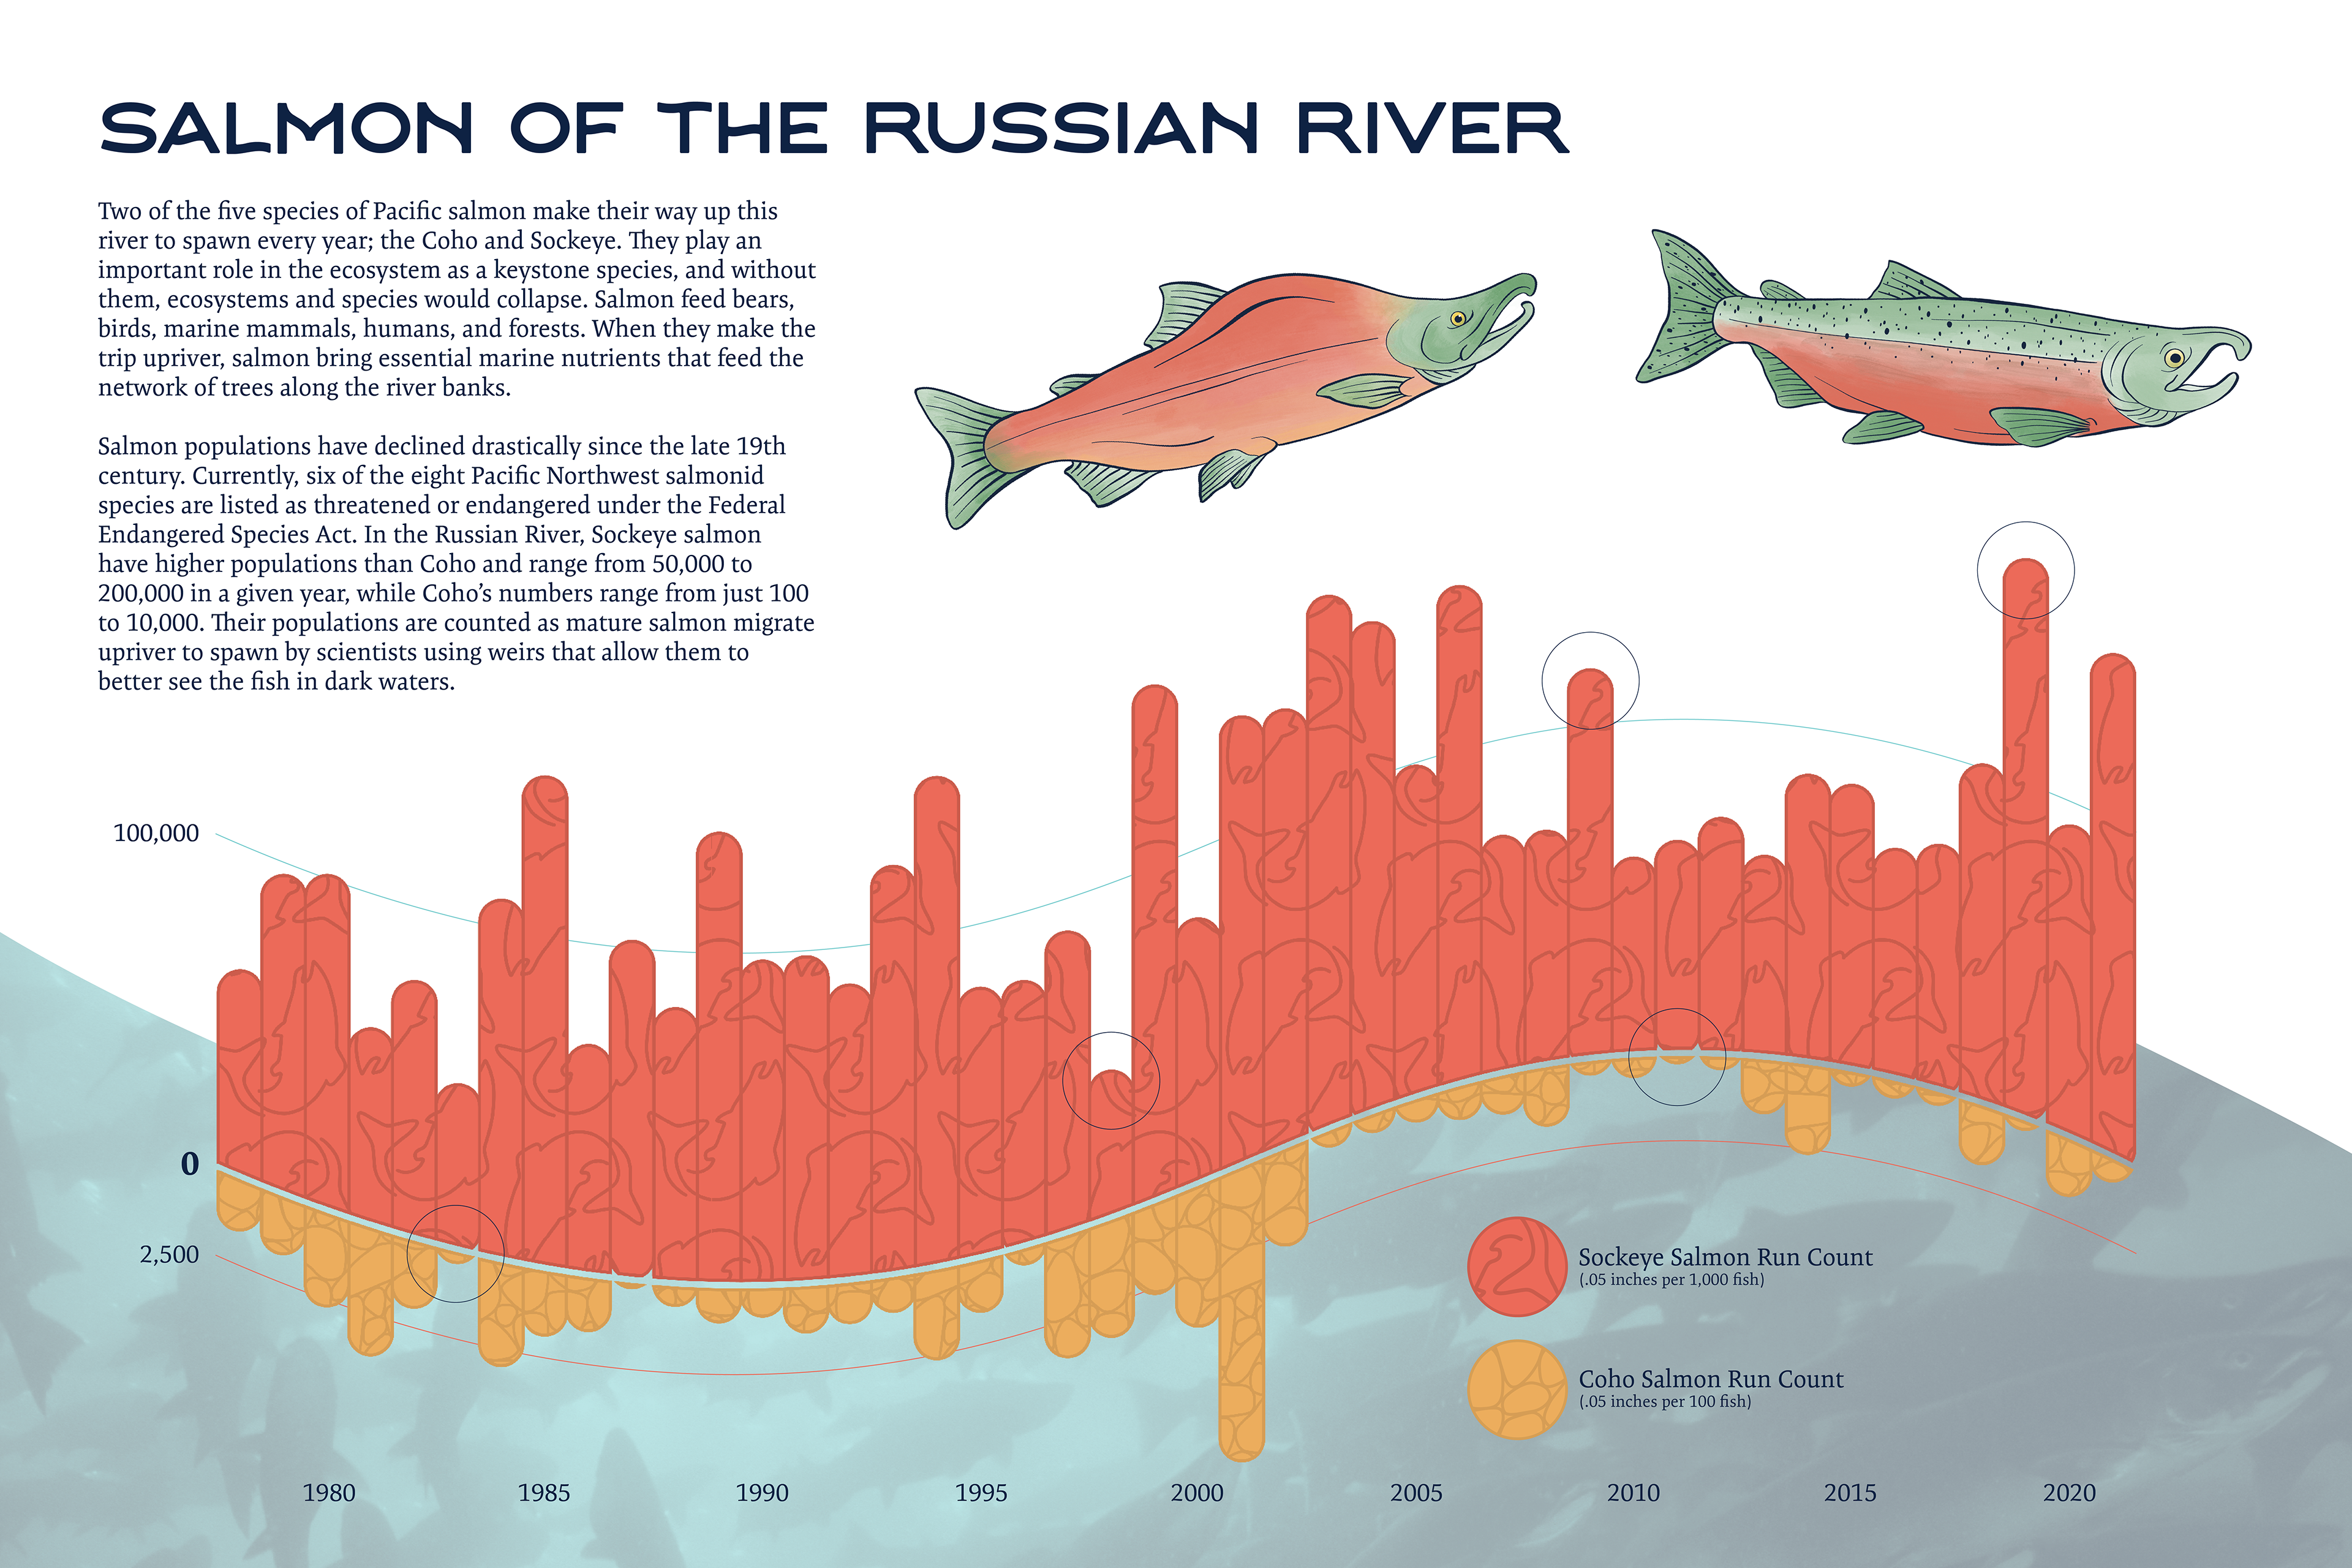
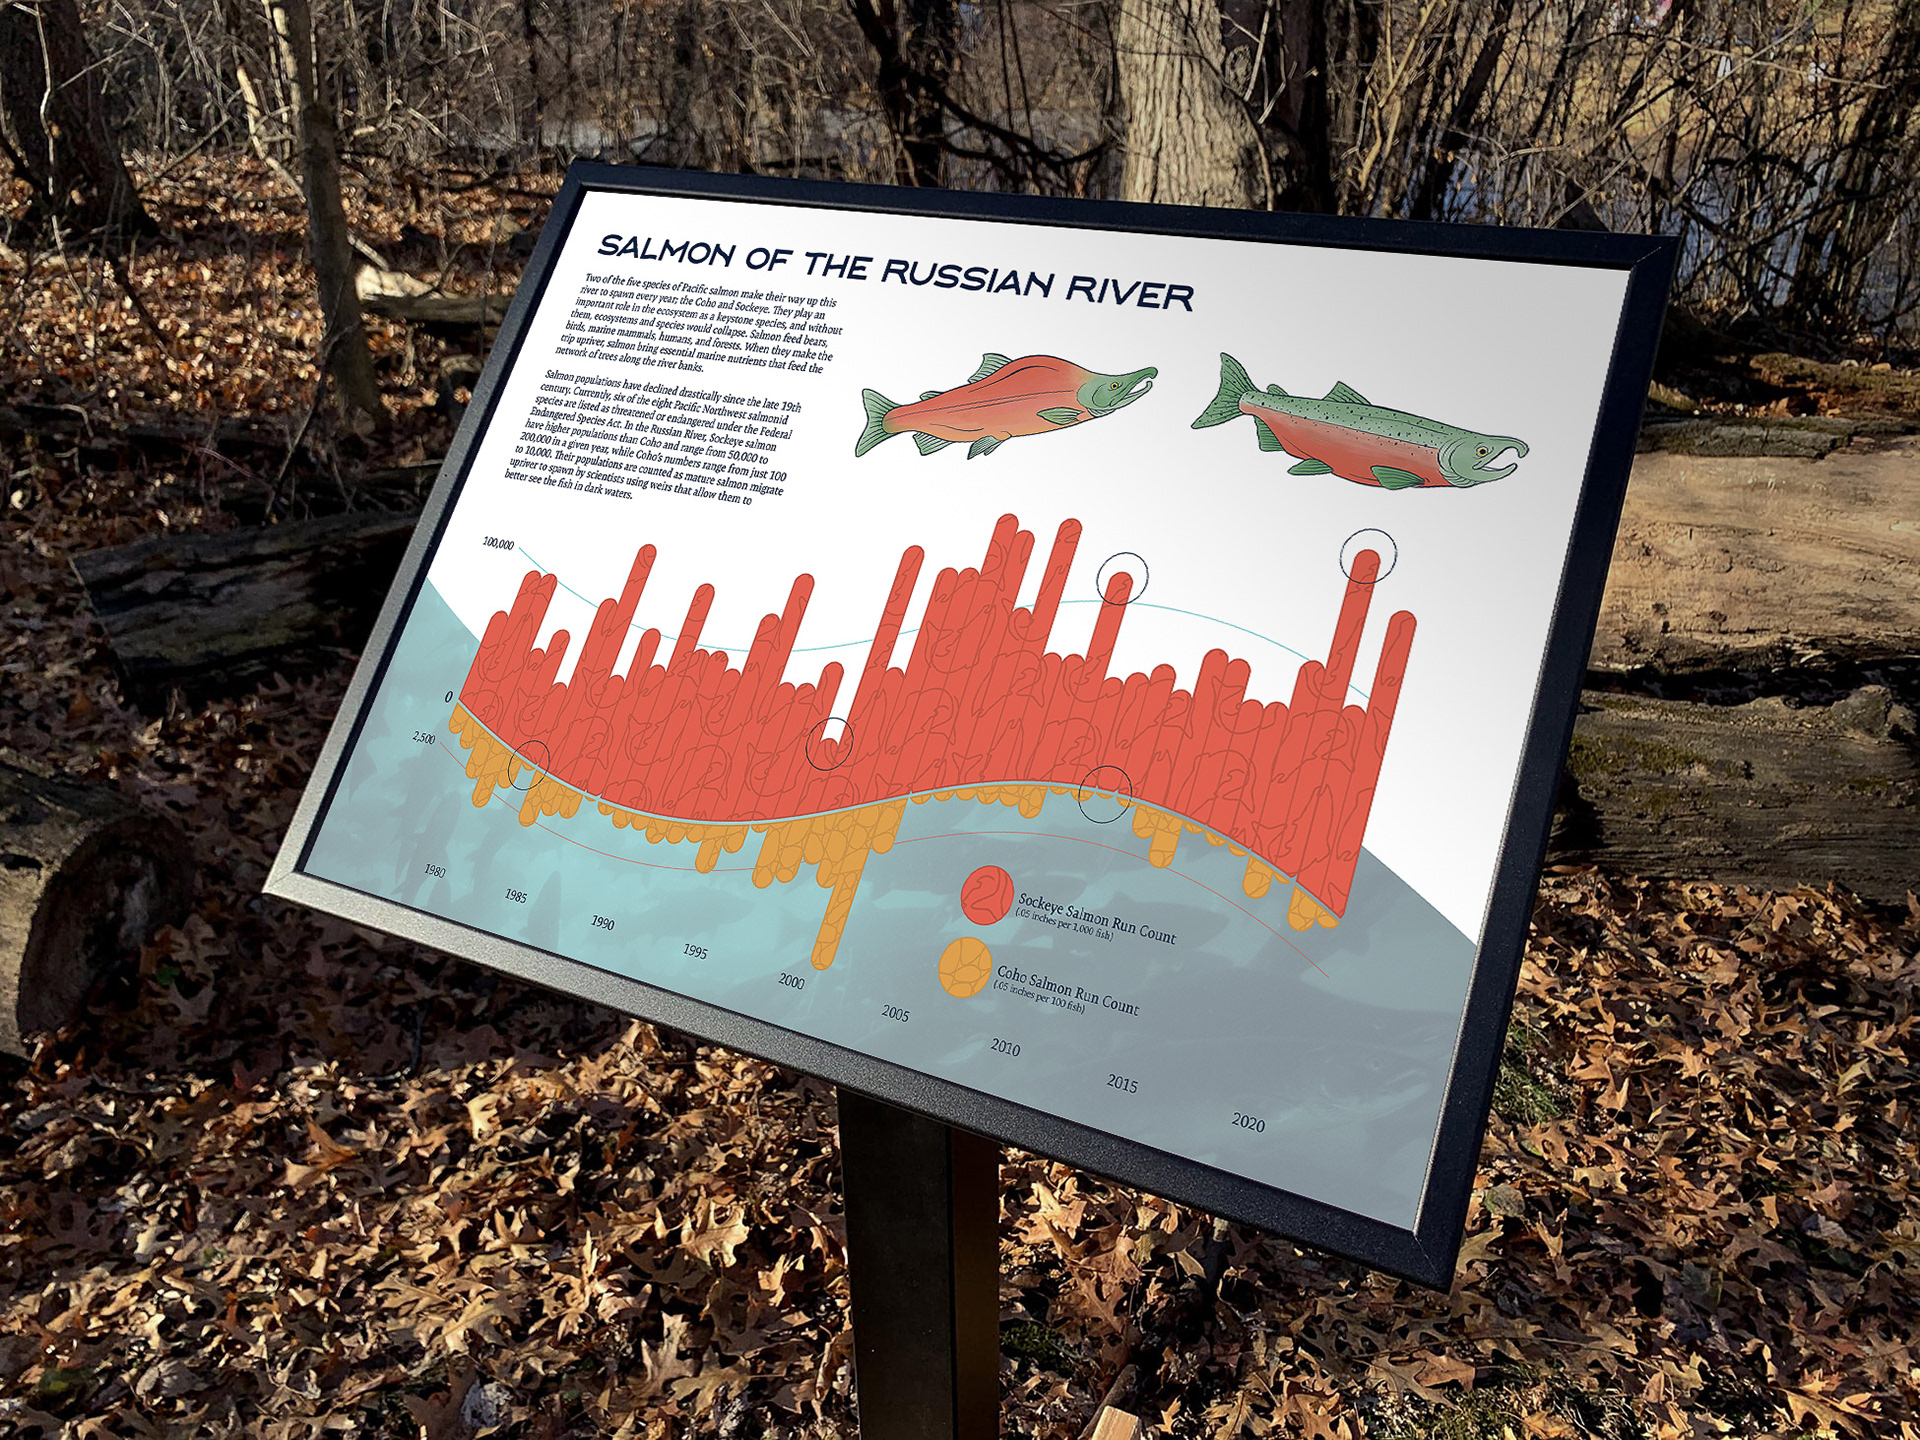
The brief for this class project was to transform data into an informative design. My goal was to translate data on salmon populations in the Russian River in Alaska into an interactive sign that would be placed along the river. I began with analyzing population data over many decades of two salmon species. A flowy chart allowed me to represent the data in a legible way while creating intrigue. The sign has multiple points that are clickable and lead to more information. The illustrations and patterns were drawn in Procreate.